#18 Performance Review
Today we look back at our recommendations so far
The Only Value Investing Crypto Newsletter | 100% hype free
Month over Month Review
It looks like we know how to pick em’. Only one of our darling cryptos on our watch list underperformed the top cryptos by market cap. LUNA stands out from the crowd with a 143% gain this past month. If you’ve been paying attention we’ve been giving out news on LUNA and our cheat sheet has guided you to this point. The four cryptos we watch because we believe in their long term value are up on average 87% in the last month while the top four cryptos by Market Capitalization are only up 46% on average in the past month.
Are you buying these tokens? Did you read our guide on how to buy them on Sushiswap and Uniswap? Got questions? Leave them in the comments.
Our How To DeFi series will continue next week with a guide on becoming a liquidity provider and staking to earn yield. Both great ways to earn passive income.
We are asking for $8.5 a month for this newsletter. We showed you how to buy LUNA, SUSHI, MATIC and AAVE on Uniswap or Sushiswap and if you did that then you’d be retiring tomorrow. We are constantly looking at the markets and accessing current dynamics and new projects to pick the best out of all the noise.
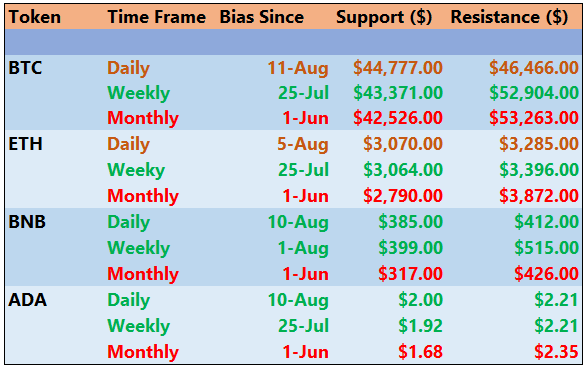
CHEAT SHEET
(You can print this out at work to follow along.)

It was only over the last few days that ADA has begun to rally. The price is up 45% in just the past four days. Promises that their smart contracts will launch soon has been a catalyst for the tokens price to rocket upwards over the past few days. Resistance is at $2.21 for the daily and the weekly.
Be sure to follow along with out cheat sheet so you can look for key levels to buy in or sell out of positions.
What We Are Watching

We further breakdown our case for these cryptos here : What We Are Watching
Below is an excerpt from Yesterday’s publication for paid subscribers.
TAKE ME TO (BTC) MAXI TOWN
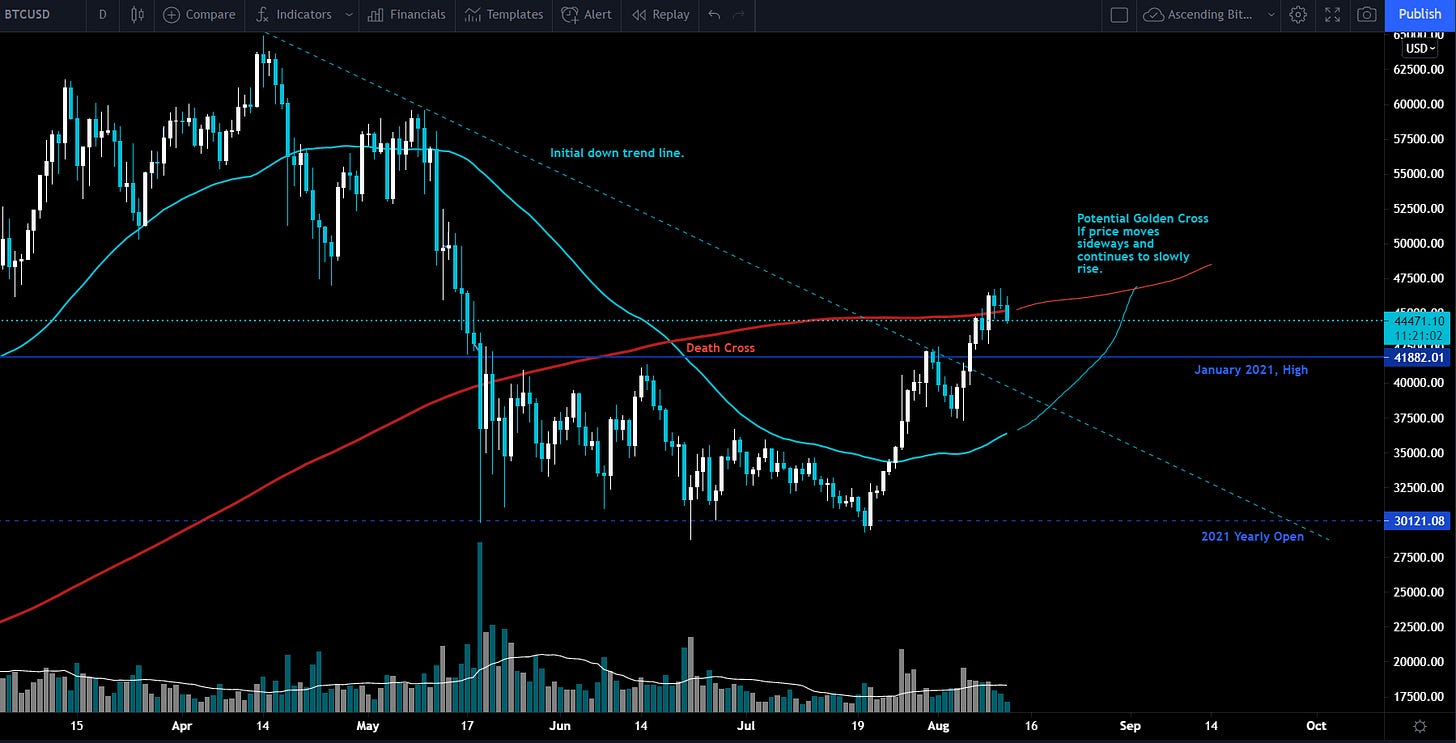
Here’s a link to a tradingview.com post I made on June 21.
On this chart you can see the 50 day moving average (solid teal line) and the 200 day moving average (solid red line). In late June a Death Cross occurred on the chart. This is when the 50 day moving average crosses below the 200 day moving average. This can often signal a down trend, but if you notice it is a lagging indicator. Most of the downturn was over by the time the death cross happened.
It looks like if the current short term upward momentum continues then around September 1st there will be a Golden Cross on the chart. This is when the 50 day moving average crosses above the 200 day moving average. This can often signal an uptrend, but again it is a lagging indicator. In order for the golden cross to occur Bitcoin’s price would need to stay above the 200 day moving average for 50 days.
The point is. IF the golden cross is going to occur then the price run up before the cross happens is likely already halfway over.
On the other hand the Golden Cross could never happen. Bitcoin’s price fell below the 200 day moving average last night and needs to find a point of support. This could be at the January 2021 High around $42,000.
Possible Course of Action
You could put a buy order at $42,000 with a tight stop loss.
If you are already long do nothing. A similar stop loss below $42,000 would be prudent.
You could try to short it down to $42,000 but the risk/reward is not that good. You should use an ultra tight stop loss and we guess you’ll get burnt by fees.
Price Action Summary
The Bulls’ Defense:
Price in short term uptrend
On-chain analysis shows whales are taking Bitcoin off exchanges in large quantity
The Bears’ Prosecution:
Price is below 200 day moving average
Still 20+ days away from a golden cross. Momentum could leave and price could start drifting downward.
Recent News
The family that bet everything on bitcoin when it was $900 is now storing it in secret vaults on four different continents.
Bitcoin energy usage cleaner than every major industry – report.
Silicon Valley leader Mark Cuban speaks against $1 trillion infrastructure bill, backs up Crypto.
ETH SHY BOY ZONE
This one is pretty simple. In the 2 day time frame ETH has been going up and to the right at 45 degrees. The RSI being above 50 merits this, and the RSI just reached a critical level of 70. This is normally an important inflection point where the price either begins to rise faster or loses steam and begins to decline. If today’s candle closes red (or in this case teal), meaning the price starts to decline today, then we’d expect to see a correction back down to the dotted white line or all the way back to the Fibonacci levels if the RSI starts to decline back towards 50.
We think this is a dip buying moment.
Possible Course of Action
If you are not in a position then look to buy at the white dashed line or wait for a pull back all the way to $2600.
You could short this one with a tight stop. Our experience so far with crypto is don’t do it. The only really good shorts require perfect timing, or identifying a major top not a local top.
The Bulls’ Defense:
Rally appears to be back intact. Price is consistently moving up and to the right in the 2 day time frame.
The Bears’ Prosecution:
If the RSI fails to go above 70 and starts to decline towards 50 the price could correct all the way to $2500
Recent News
Ethereum surpasses Mastercard and Bank of America in market value.
$100m of ETH is burned in fees since London fork.
Please share with any crypto junkies or crypto noobs you think would enjoy our content:
Don’t forget to press the like button and leave any comments or questions you have.


