
#4 Lift Off
SpaceX purchases Bitcoin, which may now be forming a short term bull flag.

The Only Value Investing Crypto Newsletter | 100% hype free
Welcome to our new subs. It’s our first week existing and we’re happy you’re here. This week, all our publications are FREE. After that, we will occasionally put out free publications, but if you want to stay up to date with the most relevant crypto news join our community by subscribing here:
CHEAT SHEET
(You can print this out at work to follow along. SpaceX bought some Bitcoin!)
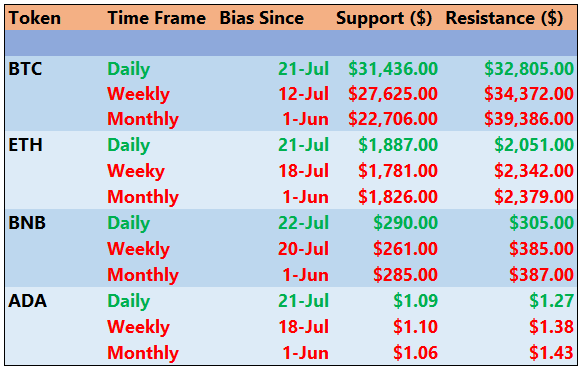
Bitcoin is in the same state as yesterday (similar support and resistance) and our momentum indicators point Bullish. Look for $32,800 to get tested again. Unless momentum shifts we think $32,800 resistance will be broken and the price will move higher.
If we do fall below $31,436 look for a quick snap back. If there is not one we expect the price to move towards the weekly resistance at $27,625.
What We Are Watching
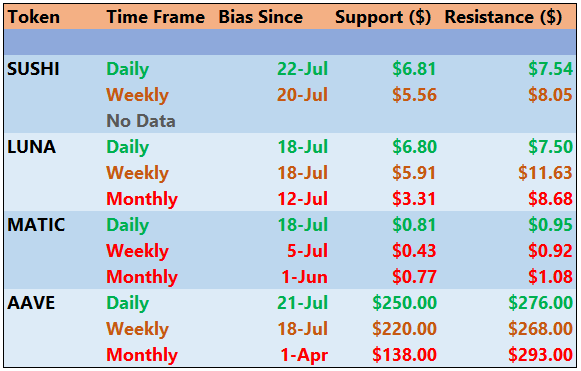
These tokens have all bounced off of (or reclaimed) their monthly support levels. Expect large short term rallies from these tokens if Bitcoin maintains its current level or continues to rise. You could put limit buys with tight stops near today’s support and put sell orders near the weekly or monthly resistance levels.
We further breakdown our case for these cryptos here : What We Are Watching
News About What We Are Watching
SUSHI - Sushiswap announces launch on xDai network.
MATIC - Ren Protocol joins a growing list of DeFi blue chips creating Polygon first native integrations.
AAVE - No news today. The AAVE community is quiet today as they recover from yesterday’s rave.
TAKE ME TO (BTC) MAXI TOWN
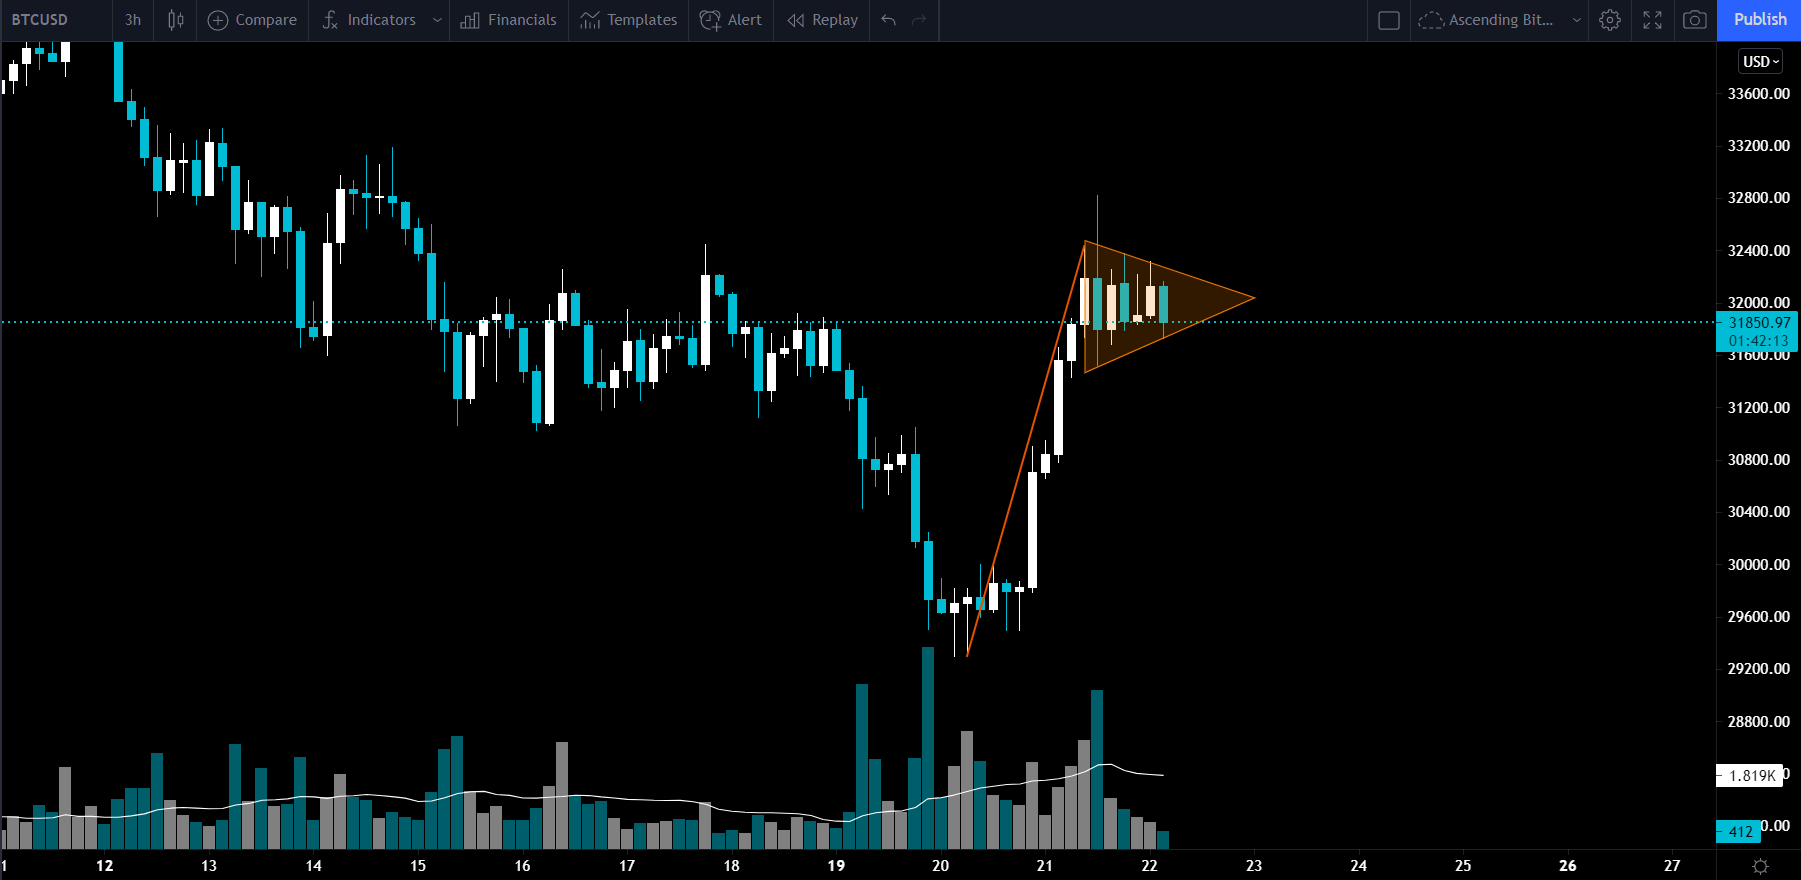
Bitcoin has held onto the short term gains from its rally that started Tuesday night. You can see on the chart above that Bitcoin appears to be forming a Bull Flag on the 3 hour timeframe. This Bull Flag is a fairly clean pattern with the exception of the wick up to $32,800. The volume increase during the flag pole phase of the price run up was strong. This gives us confidence this is in fact a Bull Flag. This pattern is more likely to break out to the upside of the triangle drawn on the chart above. However, the price may be rejected again at the $32,800 level, or fake out and fall below the triangle for a short period.
Possible Course of Action
If you caught the bottom using our resistance levels on our Cheat Sheet then you may want to sell some or close the trade entirely.
We’d be caution to buy the breakout from this triangle pattern until the price goes above or consolidates at $32,800. If the price is able to break through the $32,800 resistance this would be a great place to scale into a long. With an expectation of a retest of $40k.
Price Action Summary
The Bulls’ Defense:
Potential Bull Flag forming
Historically Bitcoin price has reverted toward the stock to flow prediction
The Bears’ Prosecution:
Price remains below 200 Day Moving Average
Multi-month down trend still intact
Recent News
Elon Musk confirms SpaceX holds Bitcoin at B-word conference.
Elon Musk says Tesla will likely start accepting Bitcoin again.
Ark Invest buys another $10.8m in Grayscale’s Bitcoin Trust.
SEC commissioner has had it with Bitcoin ETF obstructionists.
Bitcoin Miner Core Scientific to go public with $4billion valuation.
ETH SHY BOY ZONE
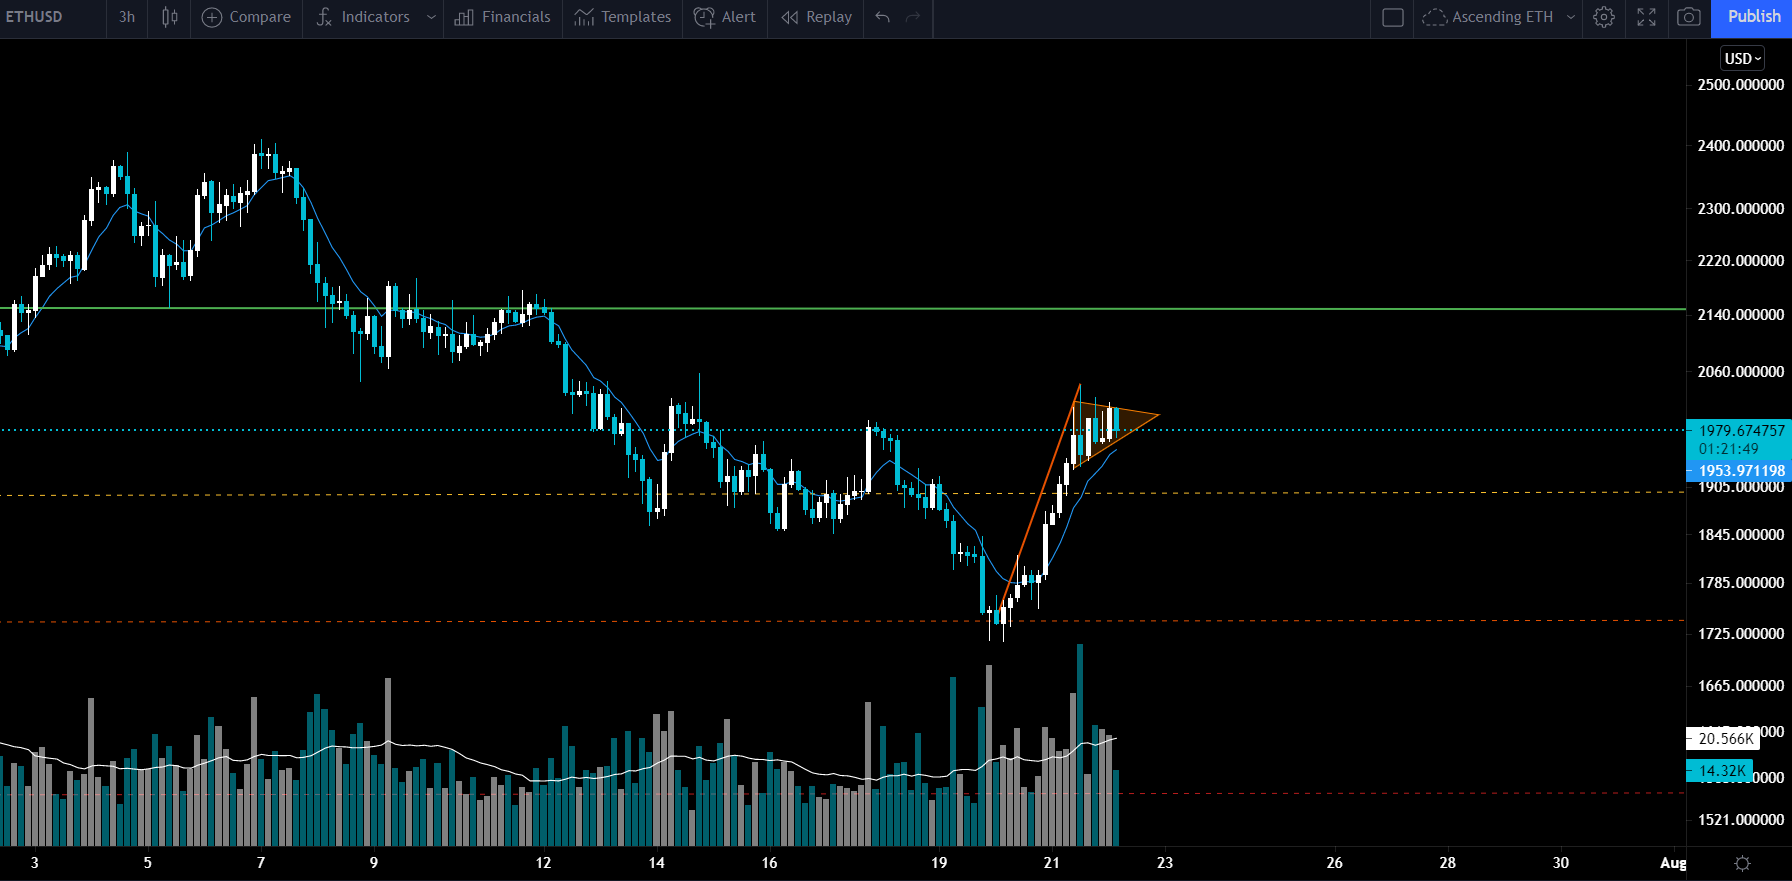
Similar to Bitcoin, a potential Bull Flag has formed on the 3 hour time frame. This pattern points to likely continuation back to the $2140 resistance level. It is still possible the rally loses steam and we quickly return to the support level around $1950. Ethereum’s short term rally is showing more strength than Bitcoin’s today up 4.4% in 24 hours vs Bitcoin being up only 1.5%.
Possible Course of Action
If you already opened a long near the $1740 support level you can close it partially or completely.
Put on a long position on a breakout to the upside of the triangle if it consolidates or goes above $2044 (yesterday’s high). The target for this long would be just under the $2140 resistance level.
Price Action Summary
The Bulls’ Defense:
Potential Bull Flag in 3 hour time frame.
Daily RSI points to potential Triple Bottom.
The Bears’ Prosecution:
Price below major support at $2,100.
Multi-month down trend still intact
Recent News
Elon Musk announces he holds an position in ETH.
Great article on using valuation models to assess DeFi applications.
Vitalik Buterin gives talk at EthCC describing what’s next for Ethereum after DeFi.
Eth 2.0 and the London Hardfork overview.
Twitter Town Thursday
Once a week we like to review the chatter on Twitter. We don’t take anything too seriously here, but it can be helpful to gauge sentiment. We think it’s a terrible idea to trade anything you read on Twitter. Always do your own research and form your own opinions.
Normally, Will Clemente sticks to on-chain analysis. Today he is giving us a classical chart and he see’s a similar pattern to the bull flag we’ve identified.

CL gives us this bleakly uncolored chart showing major liquidation events in Bitcoin’s recent history. It looks like they are suggesting Bitcoin is likely to have a short term relief rally within a few weeks to a few months after a major liquidation even.

Here at Foot Guns, Boomer has proven himself to be a Bitcoin flip signal. This means whatever Boomer thinks Bitcoin will do, it has a high probability of doing the exact opposite. Another person who is a fantastic Bitcoin flip signal is Peter Schiff. He has a nearly 100% rate at being wrong with perfect timing on Bitcoin. Each time he tweets negatively about Bitcoin, the price rally’s within 24 hours. You can see this in action from his Tweet Monday just before Bitcoin put in a local bottom.
On chain analyst Willy Woo fires back at Peter Schiff (with the same sentiment we just described) that Peter is a flip signal. Willy Woo gives us a chart showing how the amount of Bitcoin you can purchase with an ounce of gold has been declining (Peter is a gold bug). The circles drawn on the chart are a heat map showing when Peter Schiff tweets negatively about Bitcoin. Each tweet cluster represents a local top before the price of gold declined further against Bitcoin.

We’ll leave you with a chart from an on-chain analyst, _Checkmate. He shows us how Entity Adjust NVT has caught all blow off tops and major reversal lines, and here he is suggesting that this indicator has just signaled a reversal.

If you enjoyed this content subscribe here (remember this week’s FREE) :
Please share with any crypto junkies or crypto noobs you think would enjoy our content: