A Cross Made Of Gold
Bitcoin continues to hold on to the lower 20ks
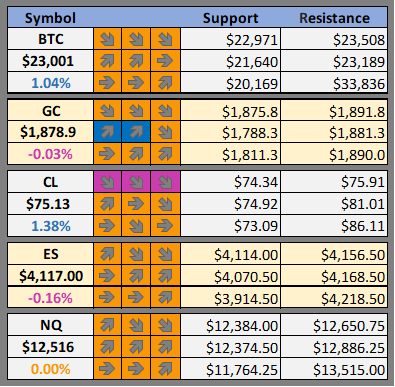
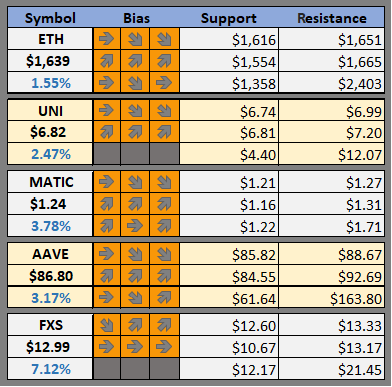
Cheat Sheet -
Support and resistance levels and our daily, weekly and monthly bias on BTC, GC, CL, ES, and NQ as well as our favorite altcoins
Are you new to Foot Guns? Learn how to read the cheat sheet here.
What We Are Watching
We further breakdown our case for these cryptos here : What We Are Watching
Crypto News
Tech giant Dell joins Hedera’s governing council (The Block)
DEX aggregator CoW Swap falls victim to $180,000 hack (The Block)
Central Banks Are Working on a Monitoring System for Stablecoin Balance Sheets (CoinDesk)
DCG Is Selling Holdings in Several Grayscale Trusts: Financial Times (CoinDesk)
‘Multichain future is very clear’ — MetaMask to support all tokens via Snaps (CoinTelegraph)
Genesis Agreement Will See Gemini Contribute $100M to Compensate Earn Users (Blockworks)
Visa Eyes High-Value USDC Settlement Payments on Ethereum (Blockworks)
Binance Will Temporarily Suspend US Dollar Bank Transfers (Decrypt)
‘Britcoin’ Consultation Lays Groundwork for UK’s Digital Pound (Decrypt)
Giannis Antetokounmpo NFT Sells for Record-Breaking $187K on Sorare NBA (Decrypt)

BTC Outlook
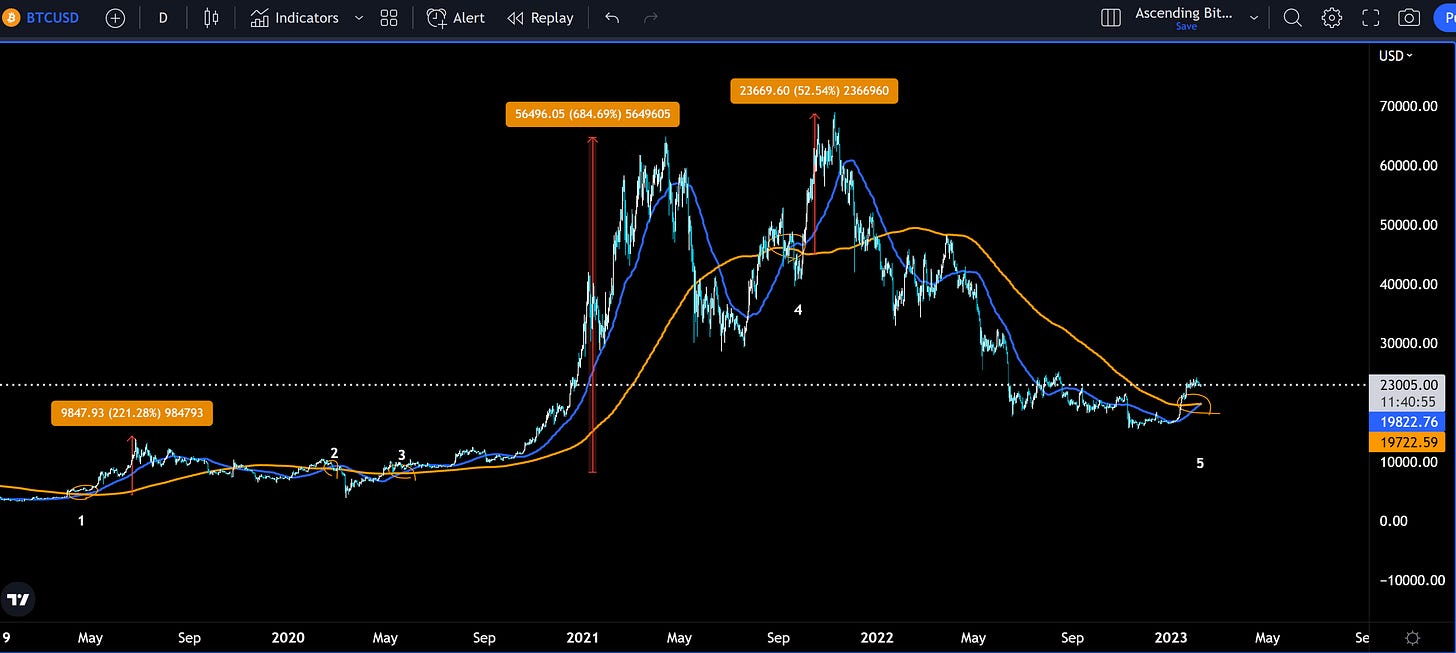
We’re back again with something constructive to say about the technicals of the BTC chart. The price has essentially been in no man’s land since May 2021 hovering around the 50 day moving average with no clear direction (basically it went sideways). However, an important technical event will occur in 11 hours or so called a “Golden Cross”. This happens when the 50 day moving average crosses above the 200 day moving average. Simply put it means that in the last 50 days Bitcoin has traded on average at a higher price than all the previous 200 days.
Based on the history of many assets and their charts, a golden cross is considered bullish and can often signal the start of a bull market. Lets review Bitcoins history since May 2019 and see how BTC in particular has behaved after this technical signal.
The first cross on our chart in May 2019 saw BTC rally 221% before making a local top.
The second cross in early 2020 had no gains and in fact saw one of the steepest and quickest sell off in BTC history. You could argue that this was a anomaly because no one saw Covid coming and the liquidity crunch that followed (a blackswan).
The third cross, which followed not long after the Covid crash, was proceeded with the largest rally in recent history. Bitcoin rallied neary 700% during which it never went below its 200 day moving average and neither did the 50 day.
The fourth cross many now argue is the scam pump inflated by over leveraged borrowing of firms like 3AC and Alameda. It was short lived, only saw a 50% rise in price and resulted in the current ATH for BTC.
So, three out of four of these golden crosses since summer 2019 have resulted in a rally. On our of four of these golden crosses was a complete false signal resulting in short term sell off. However, both of the golden crosses that were the weakest results also saw BTC’s price meeting the moving average as they crossed. The other two crosses had BTC’s price well above the moving averages. If you look at the current moment, BTC’s golden cross looks more similar to May 2019 or summer 2020. This is technically quite bullish.
Join us in discord where we actively discuss markets and where Bitcoin could be headed next.
Possible Course of Action
Get long or stay long while BTC trades above 200 day moving average
Scale into long when BTC retests 50 day moving average
Get flat/short if BTC falls back or below 200 day moving average
The Bulls’ Defense:
Currently trading above 200 day MA
The Bears’ Prosecution:
Fed likely to stay the course, continue holding interest rates high, which will continue to tame risk assets

A Closer Look
This section will be focused on taking a closer look on what Hal thinks is important to watch in the coming week.
This morning Hal continues to monitor the CANTO trade.


