Cliff Hanger
Bitcoin continues to consolidate below important resistance levels
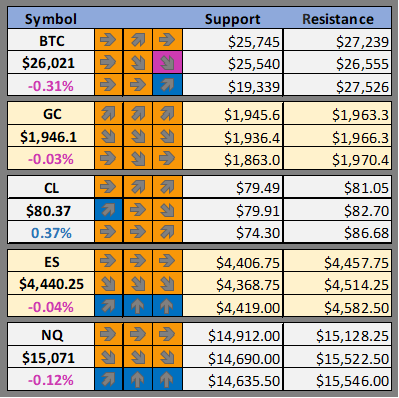
Cheat Sheet -
Current support and resistance ranges plus our bias on top cryptos, oil, and stocks.
Are you new to Foot Guns? Learn how to read the cheat sheet here.
What We Are Watching
We further breakdown our case for these cryptos here : What We Are Watching
Crypto News
All Sam Bankman-Fried's proposed witnesses should be blocked from testifying: DOJ (The Block)
Bitcoin long-term inactive supply at all-time high: Bitfinex (The Block)
The bright side of Evergrande’s collapse? More crypto volatility (CoinTelegraph)
PEPE price to zero? Pepecoin rug-pull allegations put memecoin at risk (CoinTelegraph)
Dogecoin's 10% Decline This Year Led By Bearish European Hours (CoinDesk)
First Mover Americas: Is Bitcoin Close to Breaking Out of Its Current Range? (CoinDesk)
Genesis, DCG reach chapter 11 deal, eyeing creditor recovery rates of up to 90% (Blockworks)
Approve, deny, delay? SEC to weigh in on more planned bitcoin ETFs this week (Blockworks)
Balancer Suffers Nearly $1M Exploit as Team Urges Users to Withdraw Funds (Decrypt)
US charges crypto founders over alleged support for North Korean hackers (Aljazeera)
Richard Heart’s tokens tank as billion-dollar lawsuit looms (Protos)
The Guidance: Crypto firms face the BlackRock Bitcoin land grab (DLNews)

BTC Outlook
On August 17th this year the BTC price closed below the 200 day moving average. The last time this happened was December 29th, 2021. After falling below the 200 day moving average the BTC price fell 67% before finally finding a bottom 339 days. Over the last bull cycle there were two times where the price fell below the 200 day moving average only to rally a few weeks or even days later and continued the climb upwards. Note that there are only four occasions of the price crossing and falling below the 200 day moving average in the last 3 years. This is why this newsletter pays so much attention to this particular indicator.
This year BTC has traded 217 out of a total of 240 days above the 200 day moving average. Now that the price is trading below this key level, caution should be taken. However, in all recent cases where the price fellow below the 200 day MA the price went on to retests the 200 day MA before moving lower again. This means in the coming weeks, or possibly as long as months, BTC’s price could move back up to $27,450 in an attempt to test resistance. Failure to close a daily candle above this resistance would be a good indicator to add to a short position. A candle closing above this level would make it a good idea to close shorts and consider getting long again.
There are still no near term catalysts expected to help the Bitcoin price. The market anxiously awaits the SEC decision around the various BTC ETF applications that are still pending. Until these decisions are finalized the BTC price is likely to continue consolidating sideways or slowly drifting downward.
Join us in discord where we will actively be following Bitcoin’s price action.
Possible Course of Action
If short stay short while price remains below 200 day MA
Scale into longs expecting a retest of the 200 day MA
The Bulls’ Defense:
ETF decision could still happen in 2023
The Bears’ Prosecution:
price trading below 200 day MA

A Closer Look
This section will be focused on taking a closer look on what Hal thinks is important to watch in the coming week.
This morning Hal checks in on ETH/BTC and UNI.


