The End Of The Month
Will Bitcoin close November in the green?
Cheat Sheet -
Current support and resistance ranges plus our bias on top cryptos, oil, and stocks.
Are you new to Foot Guns? Learn how to read the cheat sheet here.
What We Are Watching
We further breakdown our case for these cryptos here : What We Are Watching
Crypto News
Crypto derivatives protocol MYX raises $5 million in seed round led by HongShan (The Block)
Judge says CZ can't return to UAE ahead of sentencing, for now (The Block)
Tornado Cash token falls 57% after Binance announces delisting (CoinTelegraph)
Inferno Drainer says it’s shutting down after helping steal $70M in crypto (CoinTelegraph)
U.S. Treatment of CZ, Binance Is 'Absurd:' Arthur Hayes (CoinDesk)
CME-Listed Bitcoin, Ether Futures Flash a Rare Bullish Signal (CoinDesk)
Cosmos co-founder splits ATOM after years of infighting (Blockworks)
Cube.Exchange squares the circle of decentralization (Blockworks)
AI Can Fix Your DeFi Smart Contracts, Researchers Claim (Decrypt)
Critics decry Blast as the latest sketchy scheme on Ethereum (Protos)
Hong Kong lawmakers call for swifter action as another crypto fraud scandal rocks investors (DLNews)

BTC Outlook
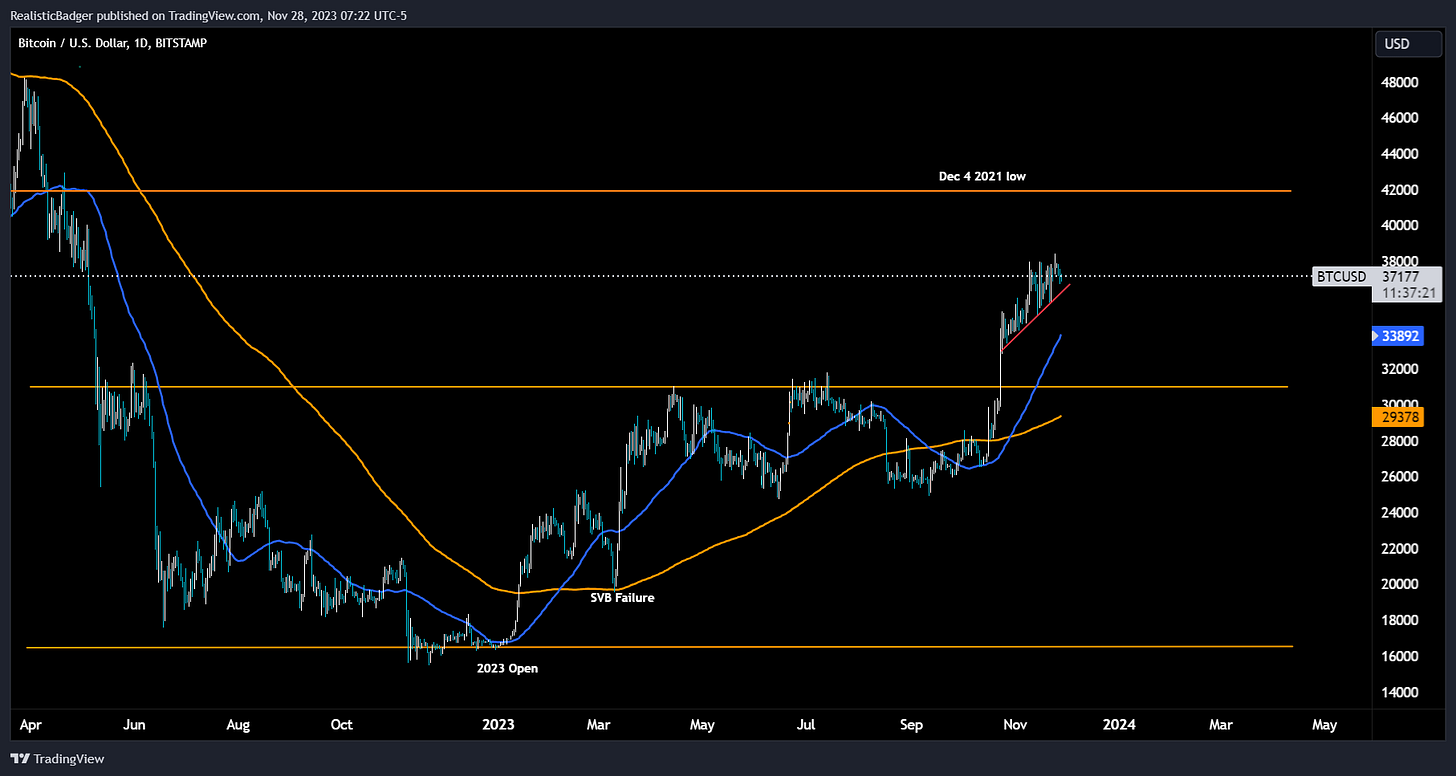
Bitcoin continues to consolidate in the center of the trading range we identified in early November. The price continues to make short term higher lows and higher highs while the 50 day moving average races upwards. Many people have been calling for Bitcoin to lose this momentum and fall back to $31k. Some people on Twitter are still even calling for $12k claiming Bitcoin looks weak and this rally is manipulated.
Most of these things are noise and Bitcoin’s price is always challenging to predict in the shorter term. The fact still remains that if, on a fundamental level, more people are adopting Bitcoin over time and it’s usage is going up then the price should continue to increase due to it’s fixed supply. We focus on the cheat sheet, which itself focuses on momentum, volume and deviations from the mean rather than arbitrary numbers like $12k.
If Bitcoin is going to lose this momentum, historically the 50 day moving average is a good place to consider support to be found. When the 50 day MA is lost, the 200 day MA tends to hold. If both are lost then the market becomes bearish support flips to resistance and you can trade the 50 day and 200 day as places to add to shorts rather than places to buy. However, it appears that in the beginning of this year the market flipped from bearish to bullish when the price began consistently trading above these key averages and the trade this year has been to scale into longs between the 50 day MA and 200 day MA. Until this pattern breaks there is no reason to fight the trend. This gives us more confidence that $31k will be the bottom of this new trading range as the 50 day MA is at ~$33k and the 200 day MA is ~29k, the middle point between these two being $31k.
It’s likely that without a catalyst to move higher, BTC will drift downward toward these support levels mentioned. However, an early ETF announcement would be unexpected by the market and there could be more upward price action pushing into the top of the range before a revisit to the bottom.
Join us in discord where we will actively be following Bitcoin’s price action as well as other markets including equities, altcoins, and commodities.
Possible Course of Action
Stay Long here while price remains above 50 day MA
Short if price falls below 200 day MA
DCA into spot long over next 6 months in anticipation of Halving (2024 summer)
The Bulls’ Defense:
ETF decision could still happen in 2023
The Bears’ Prosecution:
Break of short term uptrend could retest 50 day or 200 day MA

Want more from Foot Guns? Join our Discord where we have live conversations about the market.


