Lagging Behind
Equities move higher as crypto lags behind
Cheat Sheet -
Support and resistance levels and our daily, weekly and monthly bias on BTC, ETH, OIL, ES, and NQ as well as our favorite altcoins.
Crypto News
Solana team traces exploit back to Slope mobile wallets (The Block)
BlackRock to offer crypto access to clients through Coinbase deal (The Block)
Nomad hack: hackers return $9 million (The Block)
Chainalysis Estimates $2B Stolen From Cross-Chain Bridge Hacks This Year (CoinDesk)
PwC Crypto Head Departs to Set Up $75M Digital Asset Fund in Dubai (CoinDesk)
Tourists flock to El Salvador despite Bitcoin bear market (CoinTelegraph)
Senator Warren proposes reducing Wall Street’s involvement in crypto (CoinTelegraph)
Nansen admits neglecting DeFi plans during the NFT craze (CoinTelegraph)
Starbucks teases Web3 rewards program to attract new customers (CoinTelegraph)
Ex-Coinbase Employee Accused of Insider Trading Pleads Not Guilty (Blockworks)
BitMEX Co-Founder Fights UK Watchdog Over His Financial Data (Blockworks)
Coinbase Turns to Supreme Court to Settle Lawsuits From Account Holders (Decrypt)
How Solana Vigilantes Battled Back Against the Wallet Hacker (Decrypt)

BTC Outlook
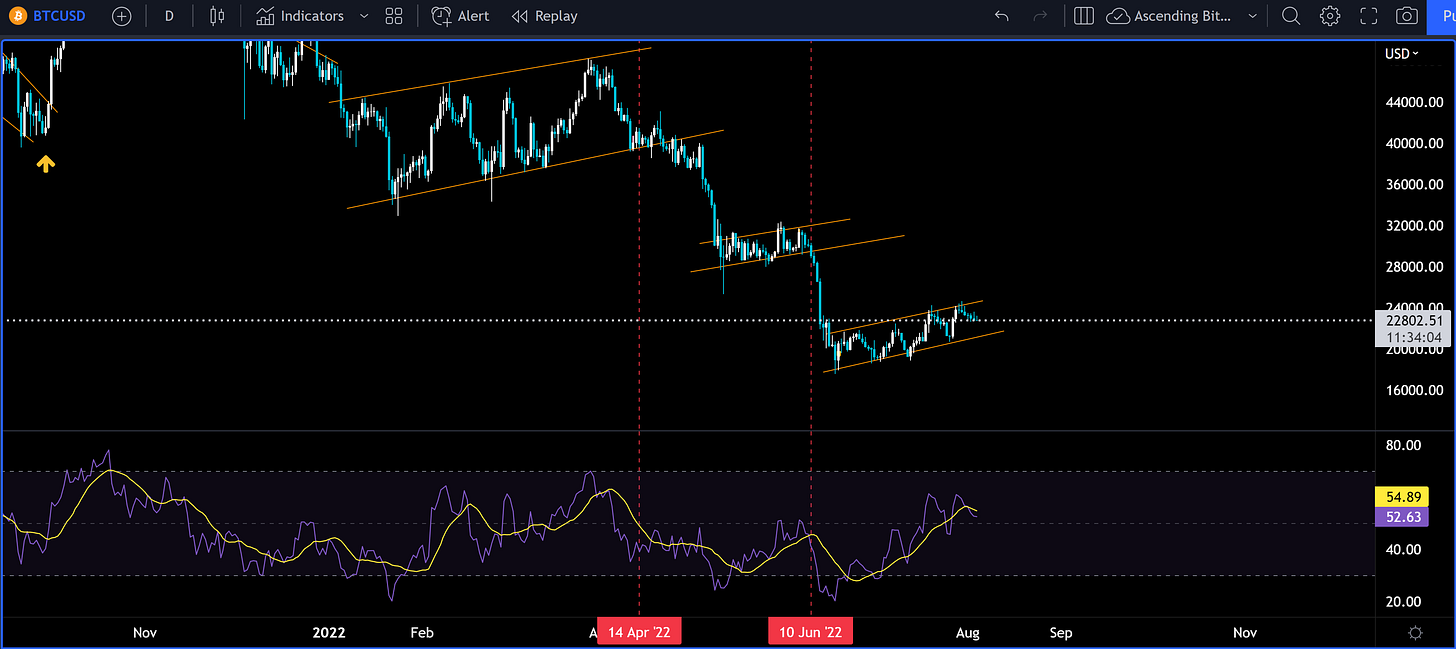
No big update today because the price has essentially moved sideways since Tuesday. Some things to note is that recent local high was only a small percentage higher than the previous one. This is normally not a good sign as any breakout buyers are now feeling anxious because they are not getting any notable returns on their investment. One thing to note is the RSI. This is a momentum indicator so what it does is measures the magnitude of the price move relative to the speed of the move.
As you can see in the above chart, the RSI during the current consolidation has climbed higher than the consolidation around $30k. This can be good and bad. Many interpret RSI going too high as “over bought” but in fact some of the most extreme price moves happen as RSI rises or falls. Watching what happens here, if the RSI can stay above 50 there is a higher probability that the price breaks the upside of this bear flag. If you see the RSI fall below 50 caution should be taken as this would most likely coincide with BTC falling below $21,000 and then potentially breaking to the downside of this bear flag.
Possible Course of Action
Long if $21k holds as support
Do nothing and wait for a breakout or breakdown
Short targets if BTC loses $21k ($17k, $12k, $9k)
The Bulls’ Defense:
RSI above 50
Rejection of bear flag possible
The Bears’ Prosecution:
Potential Bear Flag breakdown
A Closer Look
For today’s closer look we will focus on how crypto is lagging behind tech stocks.


